Search results
This layer represents the predicted likelihood that a given settlement is electrified, with values ranging from 0 (no electricity) to 1 (fully electrified). The data are derived from the High Resolution Electricity Access (HREA) dataset, which combines satellite observations of night-time lights with population settlement layers to estimate electricity access. Areas with low predicted electrification can help identify where decentralized renewable energy solutions may be most impactful in closing electricity access gaps.
Estimated number of jobs created directly related to the deployment of PV mini-grids. The indicator was calculated using data on the total MWh of electricity output anticipated if the total number of potential mini-grids were established within each country and the employment factors come from OECD. If the estimated number of jobs created is high, it means that PV mini-grids have a large potential both in terms of deployment and social development.
Percentage of women who worked in the 12 months preceding the survey and are working currently. A lower score reflects weaker female emancipation within the labour market, and thus a higher potential impact of electricity access for improving women empowerment.

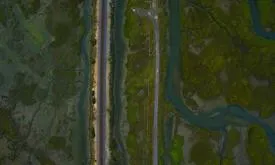
The African Development Corridors published by Thorn, J.P.R., Bignoli, D.J., Mwangi, B. et al. The African Development Corridors Database: a new tool to assess the impacts of infrastructure investments. Sci Data 9, 679 (2022) have been buffered according to the level of intervention (Major road: 15 km, Passenger and freight railway: 10 km, Railway: 5 km, Pipeline: 2,5km). Data obtained was intersected with the country boundaries and with protected areas (WDPA, February 2023 version) obtaining the percentage of PA coverage of corridors in each country.

Terrestrial Fibre Status is derived from the African Terrestrial Fibre, a map of African terrestrial fiber optic infrastructure initiatives supported by the Network Startup Resource Center. It is an Open Data initiative with data sources available for public download under a Creative Commons Attribution-Only licence (CC-BY-4.0).
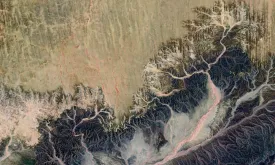
This indicator measures cropland expansion, river fragmentation and pressures on marine environments through shipping and direct human impact. Land- and sea-use change is the major human influence on habitats. Habitat loss is one of the biggest threats to biodiversity and is the number one reason species go extinct. Clearcutting forests to create agricultural lands, creating dams that change river flow and intensifying shipping in marine environments are all examples of land- and sea-use change that cause habitat destruction. This indicator includes data from terrestrial, freshwater and marine
This indicator is based on nutrient, pesticide and air pollution. Pollution is an important driver of biodiversity and ecosystem change throughout all biomes. While terrestrial ecosystems have been affected by nitrogen-phosphorous fertilisers, these have had a far more pernicious effect on the biodiversity of freshwater and marine habitats, leading to eutrophication and hypoxic or ‘dead’ zones that support no aquatic life. PM 2.5 is the annual global surface concentrations (micrograms per cubic meter) of all composition ground-level fine particulate matter of 2.5 micrometers or smaller
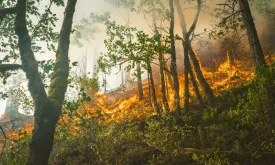
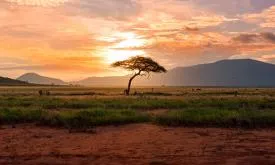
Vegetation fires have become a major concern in Africa because of their negative impacts on the environment and on human welfare. Uncontrolled (and un-prescribed) wildfires cause forest and vegetation degradation and related biodiversity loss, resulting in immediate and long-term impacts on the livelihoods of local communities and upstream impacts on national and regional economies. Fires in the tropical environment are a major contributor to tropical forest degradation and, if too frequent, can lead to savannisation of these areas. Vegetation fires are also a significant source of trace gases
The land surface forms were identified using the method developed by the Missouri Resource Assessment Partnership (MoRAP). The MoRAP method is an automated land surface form classification based on Hammond's (1964a, 1964b) classification. MoRAP made modifications to Hammond's classification, which allowed finer-resolution elevation data to be used as input data and analyses to be made using 1 km2 moving window (True, 2002; True et al., 2000). While Hammond's methodology was based on three variables, slope, local relief, and profile type, MoRAP's methodology uses only slope and local relief

This dataset shows the global distribution of coral reefs in tropical and subtropical regions. It is the most comprehensive global dataset of warm-water coral reefs to date, acting as a foundation baseline map for future, more detailed, work. This dataset was compiled from a number of sources by UNEP World Conservation Monitoring Centre (UNEPWCMC) and the WorldFish Centre, in collaboration with WRI (World Resources Institute) and TNC (The Nature Conservancy). Data sources include the Millennium Coral Reef Mapping Project (IMaRS-USF and IRD 2005, IMaRS-USF 2005) and the World Atlas of Coral

Percentage of women who experienced physical or sexual violence. This indicator focuses on the importance of bringing electricity to public infrastructures, in particular streets. Improving street lighting can make these infrastructures safer especially for women and thus reduce the number of women who experienced any type of violence in public spaces.
Understanding why and where humanitarian disasters are likely to occur is a fundamental step in saving lives and promoting sustainable development. This layer presents the coping capacity dimension of the INFORM Risk Index (global risk assessment for humanitarian crises and disasters). It measures the ability of a country to cope with disasters in terms of organized activities, infrastructure and governmental effort. It is aggregated by a geometric mean of two categories: the institutional category covers the existence of DRR programs that address mostly mitigation and preparedness, and the

The International Wealth Index is an asset-based wealth index that runs from 0 (no assets) to 100 (all assets) and is comparable across place and time. The lower the level of the Index, the greater the potential of electricity access to reduce poverty and foster development.